
Introduction
In heavy engineering, municipal construction, and high-altitude lifting, cranes are widely regarded as profit-generating assets. However, buyers entering international procurement or fleet expansion are often misled by headline nominal capacities (e.g., a ’50-Ton Crane’ or ‘100-Ton Crane’). In actual job site conditions, a 50-ton crane rarely lifts 50 tons unless the load is positioned directly adjacent to the boom base at a minimal working radius.
What truly dictates a crane’s operational envelope, mechanical safety, and Return on Investment (ROI) is its load chart. For overseas contractors, equipment rental fleets, and truck body builders, understanding how to read and audit a crane load chart is not only a safety baseline to prevent catastrophic tipping or boom failures—it is the primary technical audit tool when selecting machinery from OEMs.
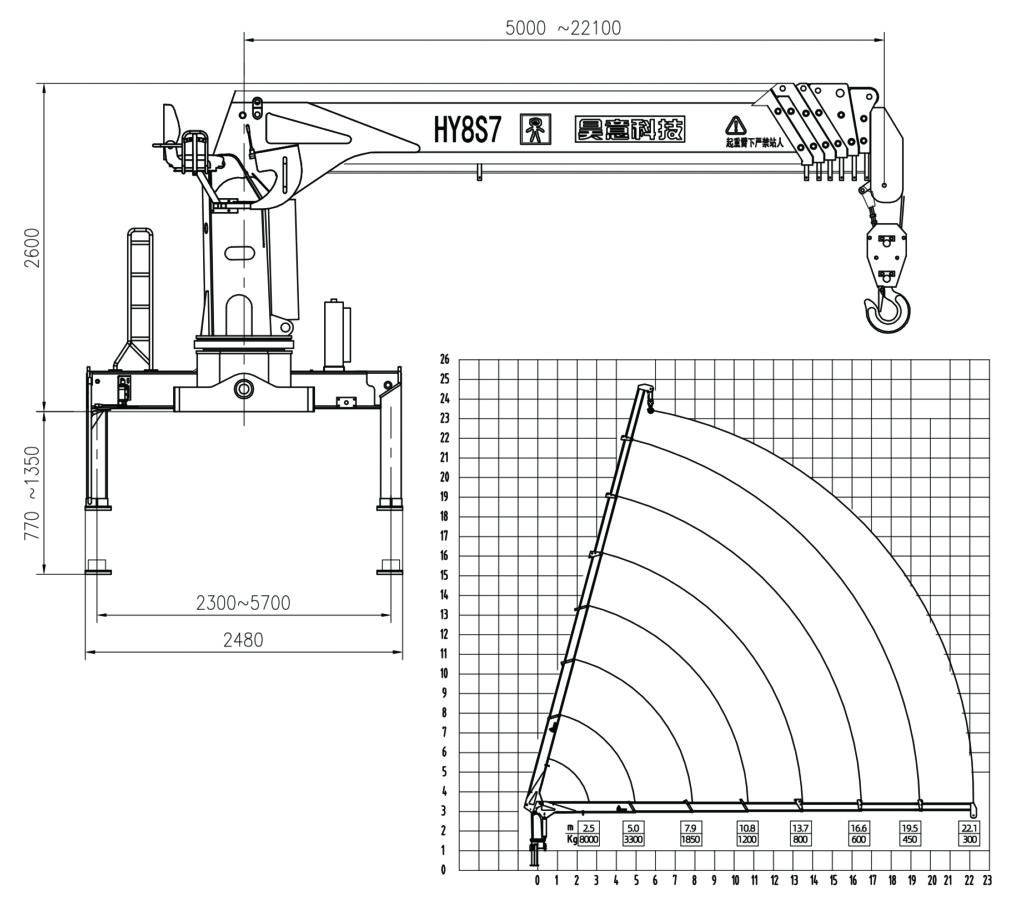
1. The 4 Critical Components of a Load Chart
A standard crane load chart consists of matrices, elevation diagrams, and operational notes. Interpreting it requires mastering four essential mechanical variables:
1.1 Operating Radius (Working Radius)
Operating radius is the horizontal distance from the center of the crane’s slewing ring to the vertical centerline of the hook block. Note: Radius is not boom length! As the boom lowers and extends, the operating radius increases, amplifying the tipping moment against the crane’s chassis exponentially.
1.2 Boom Length & Boom Angle
• Boom Length: The distance from the main boom foot pin to the center of the sheaves at the boom head.
• Boom Angle: The angle between the boom centerline and the horizontal ground. Lower angles induce higher bending stress on the boom structure, reducing allowable capacity significantly.
1.3 Gross Capacity vs. Net Capacity
Distinguishing between gross and net capacities is a common point of confusion for job site teams:
• Gross Capacity: The nominal capacity value pulled directly from the load chart matrix intersection.
• Net Capacity: Calculated as Net Capacity = Gross Capacity – (Hook Block Weight + Rigging Gear + Wire Ropes + Stowed Jib Weight). You must deduct the weight of hooks, fly jibs, vacuum lifters, and rigging lines to determine the true allowable weight of the cargo.
1.4 Outrigger Spread & Crane Orientation
Load charts specify precise baseline conditions. For example, whether outriggers are 100% fully extended, 50% mid-extended, or operating ‘on-rubber’ (without outriggers). Additionally, stability over the rear (Over-Rear) is usually greater than stability over the side (Over-Side), which is reflected in distinct chart ratings.
2. 3-Step Guide to Calculating Real Lifting Capacity
Example Scenario: Placing a 3.5-ton (3,500 kg) HVAC unit on a 15-meter high roof at a 10-meter horizontal distance from the crane’s slewing center.
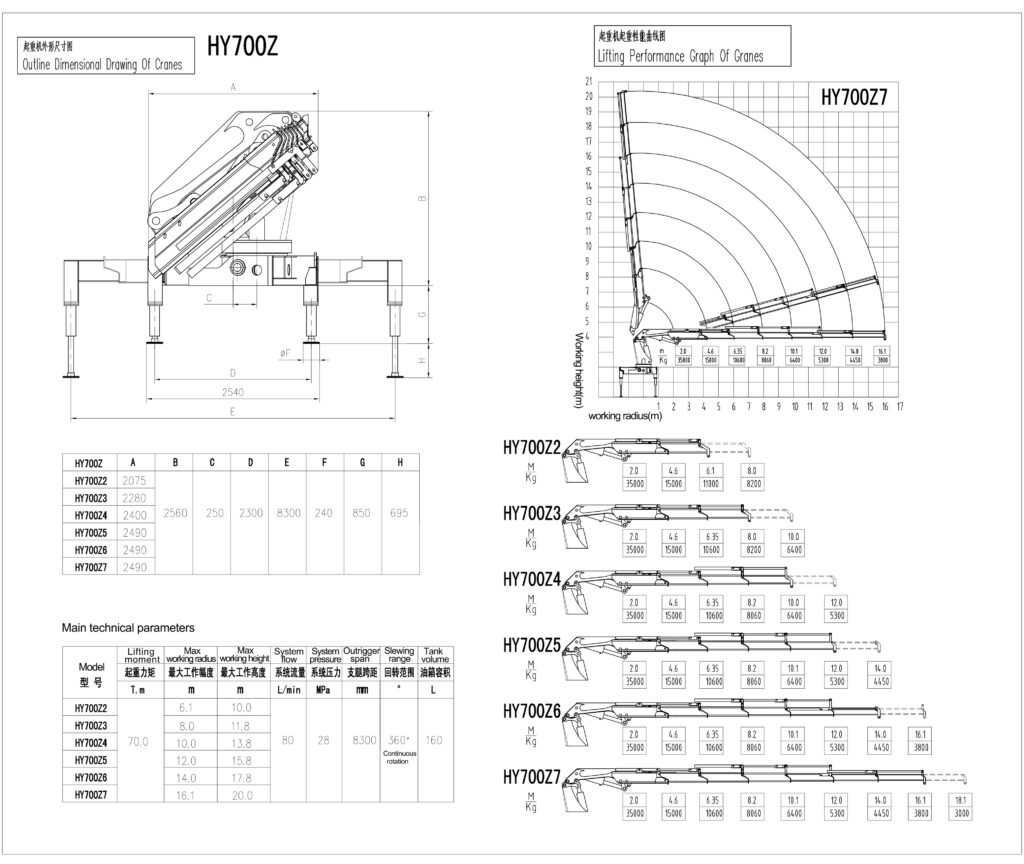
1. Step 1: Determine Geometry. Locate 10m on the horizontal axis (Radius) and 15m on the vertical axis (Height) of the Working Range Diagram. The intersection indicates the required minimum boom length (e.g., 22m) and boom angle (e.g., 55°).
2. Step 2: Lookup & Calculate Net Capacity. Open the load chart matrix for a 22m boom, navigate to the 10m radius column, and find the Gross Capacity (e.g., 4,800 kg). Deduct the hook block (200 kg) and rigging gear (150 kg) to arrive at a Net Capacity of 4,450 kg.
3. Step 3: Audit Safety Margins. The actual load (3,500 kg) is less than the Net Capacity (4,450 kg). The load utilization rate is 78.6% (3,500 / 4,450), which falls within the safe operating threshold of <85%.
3. 3 Avoidable Traps in Load Chart Evaluation
During OEM technical audits, procurement officers must check for three common specification traps:
• Trap 1: Structural Limits vs. Stability Limits
Load charts feature a bold line or shaded boundary separating two mechanical states. Values above the bold line are governed by structural strength limits (exceeding them causes structural bending or shear failure). Values below the line are governed by tipping stability limits (exceeding them causes machine rollover). Ensure chart testing follows recognized standards such as ASME B30.5 or EN 13000.
• Trap 2: Overlooking Partial Outrigger Extension
In confined urban job sites, outriggers cannot always be fully extended. Operating with mid-extended outriggers while relying on a 100% full-extension chart creates severe tipping risks. Premium OEMs provide dedicated Mid-Extension and Minimum-Extension charts that automatically integrate with the Load Moment Indicator (LMI) system.
• Trap 3: Focusing Solely on Max Rated Lift
A crane advertised as ’50 tons’ usually achieves that rating only at a minimal 2.5m radius. At a 15m radius, allowable lifting capacity might drop below 3 tons. Always compare lifting curves at operational radiuses rather than focusing solely on nominal headline capacities.
4. Auditing Load Charts in OEM Contracts
To secure fleet investments, include the following three technical verification rules in purchase contracts:
1. Mandate Multi-Standard Chart Compliance: Ensure load charts comply with international engineering standards such as EN 13000, ASME B30.5, or ISO 4305, which mandate strict tipping safety margins (e.g., maximum 75%-85% tipping load threshold).
2. Review Specialized Machine Charts: For truck mounted cranes, require 360° full-rotation charts and over-cab restriction charts. For spider cranes, audit asymmetric outrigger footprint capacity curves.3. Verify LMI Hardware Integration: Confirm that all chart variables and load curves are pre-programmed into the onboard Load Moment Indicator (LMI) computer to automatically lockout dangerous hydraulic functions during an overload.
Conclusion
Understanding a crane load chart is a core management asset in the B2B machinery lifecycle. By mastering the mechanical relationships between working radius, boom angle, outrigger posture, and net capacities, procurement managers eliminate false specification claims, prevent job site accidents, and protect capital assets. Treating the load chart as an absolute engineering limit ensures every heavy lifting project delivers safe, predictable, and profitable commercial returns.
FAQs
Q1: What is the difference between Gross Capacity and Net Capacity on a crane load chart?
A: Gross Capacity is the raw weight limit shown in the load chart table at a specific boom angle and radius. Net Capacity is the actual weight of the cargo you can lift after subtracting the weight of the hook block, rigging gear, hoist wire ropes, and any stowed jib from the Gross Capacity.
Q2: Why does a 50-ton crane lift significantly less weight at a 10-meter radius?
A: Crane lifting capacity is governed by structural leverage and tipping moment. As the working radius increases, the leverage force applied by the load grows exponentially. To prevent structural failure or vehicle tipping, the allowable weight must drop sharply as radius increases.
Q3: What does the bold line on a crane load chart signify?
A: The bold line (or shaded boundary) separates structural capacity limits from stability capacity limits. Ratings above the bold line are based on the crane’s material/structural strength limit, while ratings below the line are based on the machine’s resistance to tipping.
Q4: Can I operate a crane safely if the outriggers are only partially extended?
A: Yes, but ONLY if you consult the specific ‘Mid-Extension’ or ‘Partial Extension’ load chart provided by the manufacturer. Operating a crane with partially extended outriggers using the 100% full-extension load chart will cause severe tipping accidents.